Slide Notes for: [ Slide 1 ]
Slide Notes for: [ Slide 2 ]
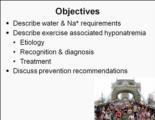
Slide Notes for: [ Slide 3 ]
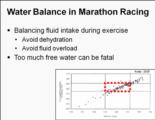
Slide Notes for: [ Slide 4 ]
Slide Notes for: [ Slide 5 ]
Slide Notes for: [ Slide 6 ]
Slide Notes for: [ Slide 7 ]
Slide Notes for: [ Slide 8 ]
Slide Notes for: [ Slide 9 ]
Slide Notes for: [ Slide 10 ]
Slide Notes for: [ Slide 11 ]
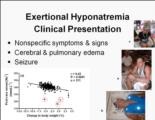
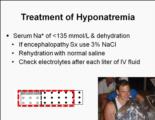
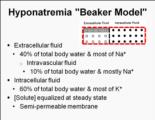
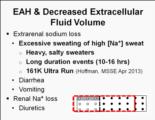
exercise related hyponatremia is hypotonic except in the rare instance of hyperglycemia excess fluid decreased extracellular fluid with Na loss
Slide Notes for: [ Slide 12 ]
Slide Notes for: [ Slide 13 ]
Slide Notes for: [ Slide 14 ]
Evolutionary advantage to the male proclivity to forge ahead without reading the instructions.
Slide Notes for: [ Slide 15 ]
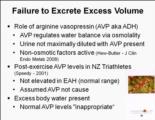
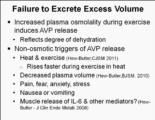
Clinical medicine AVP is elevated in all cases of hyponatremia
Slide Notes for: [ Slide 16 ]
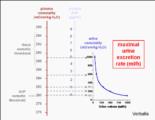
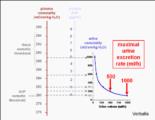
*This is a great illustration based on experiments and formulas published by Robertson et al. in 1976. I do not know exactly what will be spoken, but important to understand that the numbers provided for Posm and Uosm are for people at rest who were volume diluted at the start of experiments in order to properly test the study hypotheses. For example, people might normally walk around with Posm 294, but Uosm would not be maximally concentrated at > 1000! It is only so in the figure because the starting value was so low (280). The delta, however, (Posm 14) explainas the outcome Uosm. The numbers are a product of the formulas and conditions tested. See Cheuvront et al. Am J Clin Nutr 2013 (Physiologic basis for understanding quantitative dehydration assessment) if interested in more details.
Slide Notes for: [ Slide 17 ]
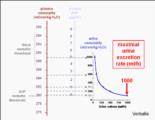
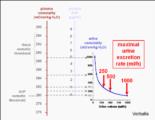
*This is a great illustration based on experiments and formulas published by Robertson et al. in 1976. I do not know exactly what will be spoken, but important to understand that the numbers provided for Posm and Uosm are for people at rest who were volume diluted at the start of experiments in order to properly test the study hypotheses. For example, people might normally walk around with Posm 294, but Uosm would not be maximally concentrated at > 1000! It is only so in the figure because the starting value was so low (280). The delta, however, (Posm 14) explainas the outcome Uosm. The numbers are a product of the formulas and conditions tested. See Cheuvront et al. Am J Clin Nutr 2013 (Physiologic basis for understanding quantitative dehydration assessment) if interested in more details.
Slide Notes for: [ Slide 18 ]
*This is a great illustration based on experiments and formulas published by Robertson et al. in 1976. I do not know exactly what will be spoken, but important to understand that the numbers provided for Posm and Uosm are for people at rest who were volume diluted at the start of experiments in order to properly test the study hypotheses. For example, people might normally walk around with Posm 294, but Uosm would not be maximally concentrated at > 1000! It is only so in the figure because the starting value was so low (280). The delta, however, (Posm 14) explainas the outcome Uosm. The numbers are a product of the formulas and conditions tested. See Cheuvront et al. Am J Clin Nutr 2013 (Physiologic basis for understanding quantitative dehydration assessment) if interested in more details.
Slide Notes for: [ Slide 19 ]
*This is a great illustration based on experiments and formulas published by Robertson et al. in 1976. I do not know exactly what will be spoken, but important to understand that the numbers provided for Posm and Uosm are for people at rest who were volume diluted at the start of experiments in order to properly test the study hypotheses. For example, people might normally walk around with Posm 294, but Uosm would not be maximally concentrated at > 1000! It is only so in the figure because the starting value was so low (280). The delta, however, (Posm 14) explainas the outcome Uosm. The numbers are a product of the formulas and conditions tested. See Cheuvront et al. Am J Clin Nutr 2013 (Physiologic basis for understanding quantitative dehydration assessment) if interested in more details.
Slide Notes for: [ Slide 20 ]
Slide Notes for: [ Slide 21 ]
Slide Notes for: [ Slide 22 ]
Slide Notes for: [ Slide 23 ]
Slide Notes for: [ Slide 24 ]
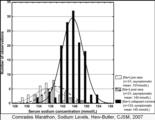
Data to be presented at ACSM Annual Meeting in St Louis NSAID's no effect Linear dose response curve Na vs fluid volume intake
Slide Notes for: [ Slide 25 ]
Slide Notes for: [ Slide 26 ]
Slide Notes for: [ Slide 27 ]
Slide Notes for: [ Slide 28 ]
Slide Notes for: [ Slide 29 ]
Slide Notes for: [ Slide 30 ]
Intracellular space expands based on Na concentration Hypovolemic top Hypervolemic bottom
Slide Notes for: [ Slide 31 ]
Slide Notes for: [ Slide 32 ]
Slide Notes for: [ Slide 33 ]
Guest staff Case 1: 3.5 hour male finisher. Suspected hyponatremia "drank at every water station. How much is a drink? Like the alcoholic - get a definition of a "drink". 2 swallows Case 2: 4.5 hour female finisher. Had 2 full glasses at every water stop. Severe HA, vomited, ashen color. Na 122
Slide Notes for: [ Slide 34 ]
Slide Notes for: [ Slide 35 ]
Slide Notes for: [ Slide 36 ]
Slide Notes for: [ Slide 37 ]
Slide Notes for: [ Slide 38 ]
Slide Notes for: [ Slide 39 ]
Slide Notes for: [ Slide 40 ]
Slide Notes for: [ Slide 41 ]
Slide Notes for: [ Slide 42 ]
Slide Notes for: [ Slide 43 ]
Slide Notes for: [ Slide 44 ]
Slide Notes for: [ Slide 45 ]


![Click to View: 30. Low Extracellular [Na+]](tslide_30_52.jpg)